Analyze your sales on MY orderbird

Übersicht
In order to have a quick overview of how your business is doing at any time, you can find your sales data clearly visualized on [MY orderbird] > [Sales dashboard].
The Sales Dashboard
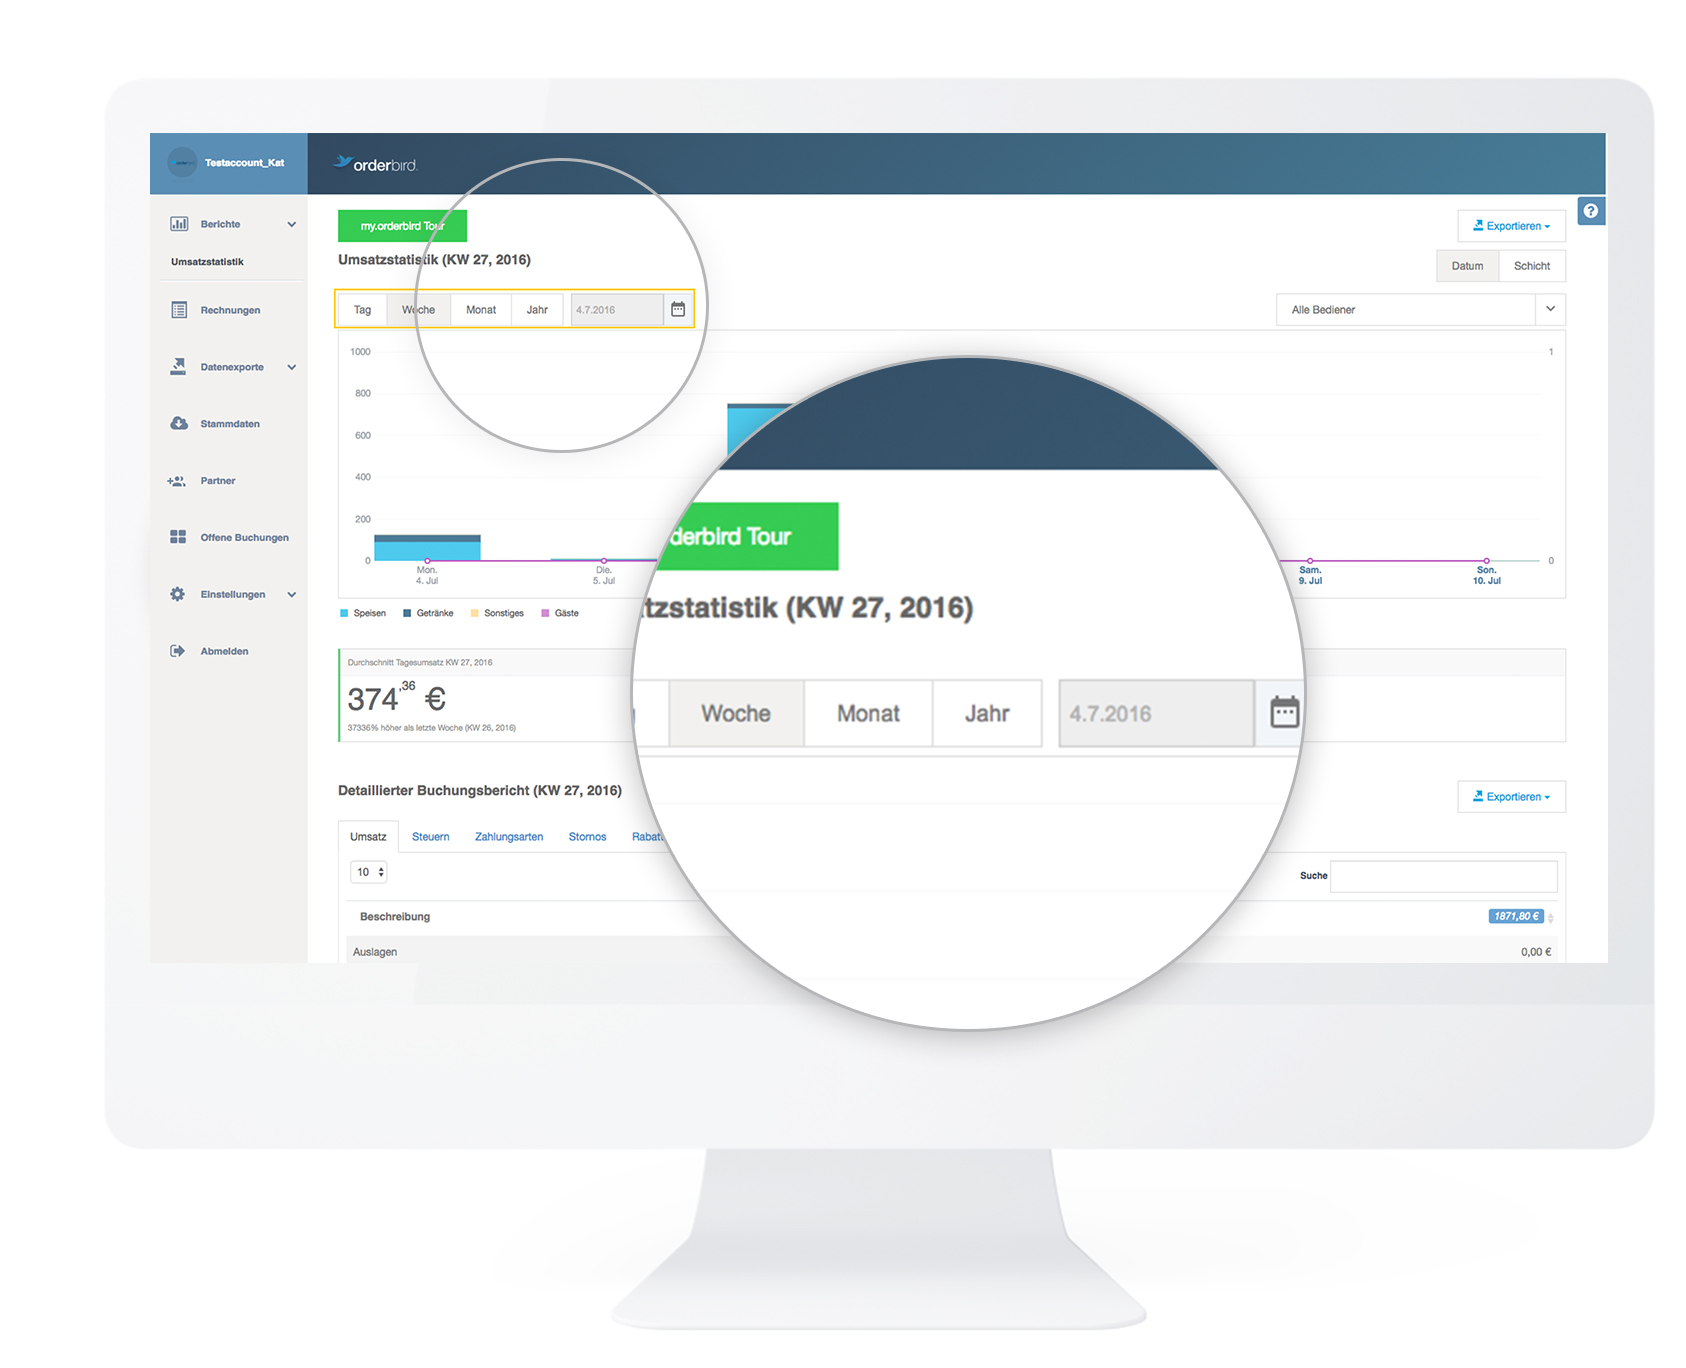
- You can visualize your sales by day, week, month or year. For example, you can always send a monthly report to your tax consultant at the end of the month.
- Alternatively, you can also call them up separately according to shifts ("cash days").
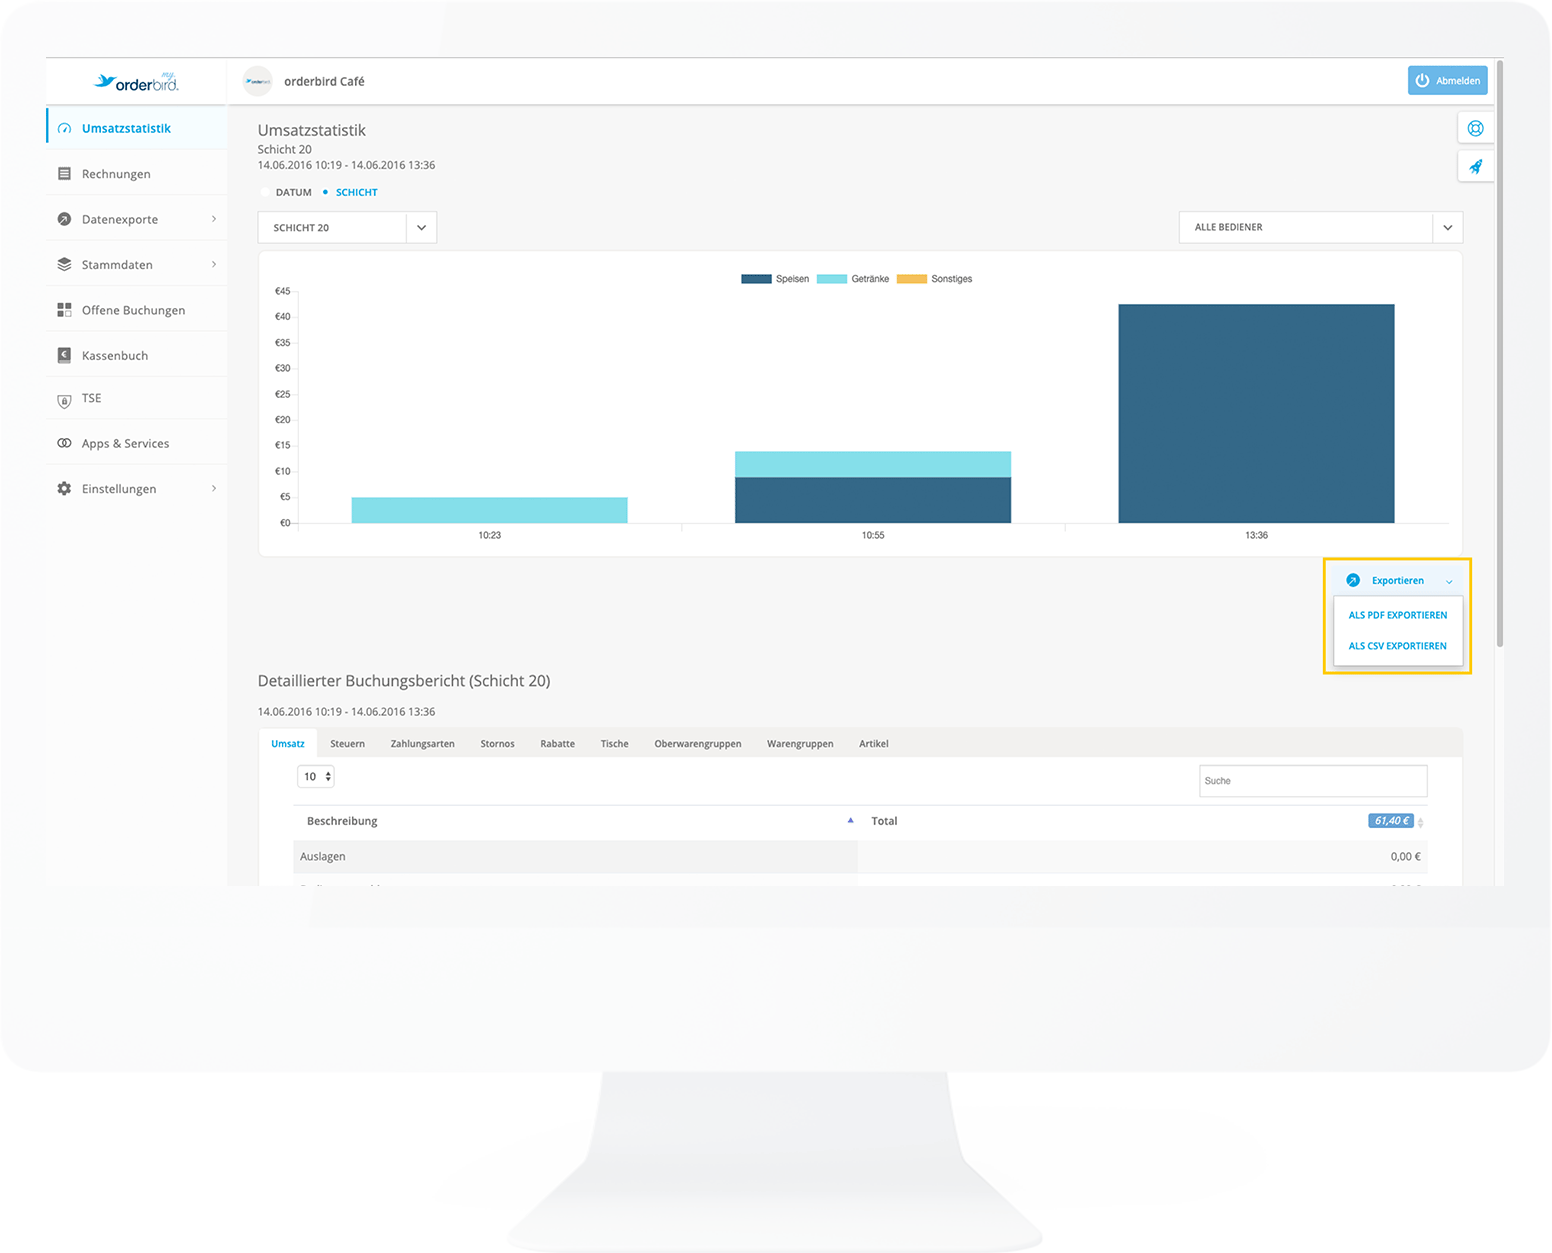
You will automatically see the daily, weekly and monthly turnover of the selected period and how it compares to the previous week or month. - Right below the sales statistics, you have the possibility to [Export] them and save them on your computer for further analysis. You can choose between PDF and CSV file for export.
The detailed report
To find out exactly which items are your top sellers, scroll down to the detailed booking report. 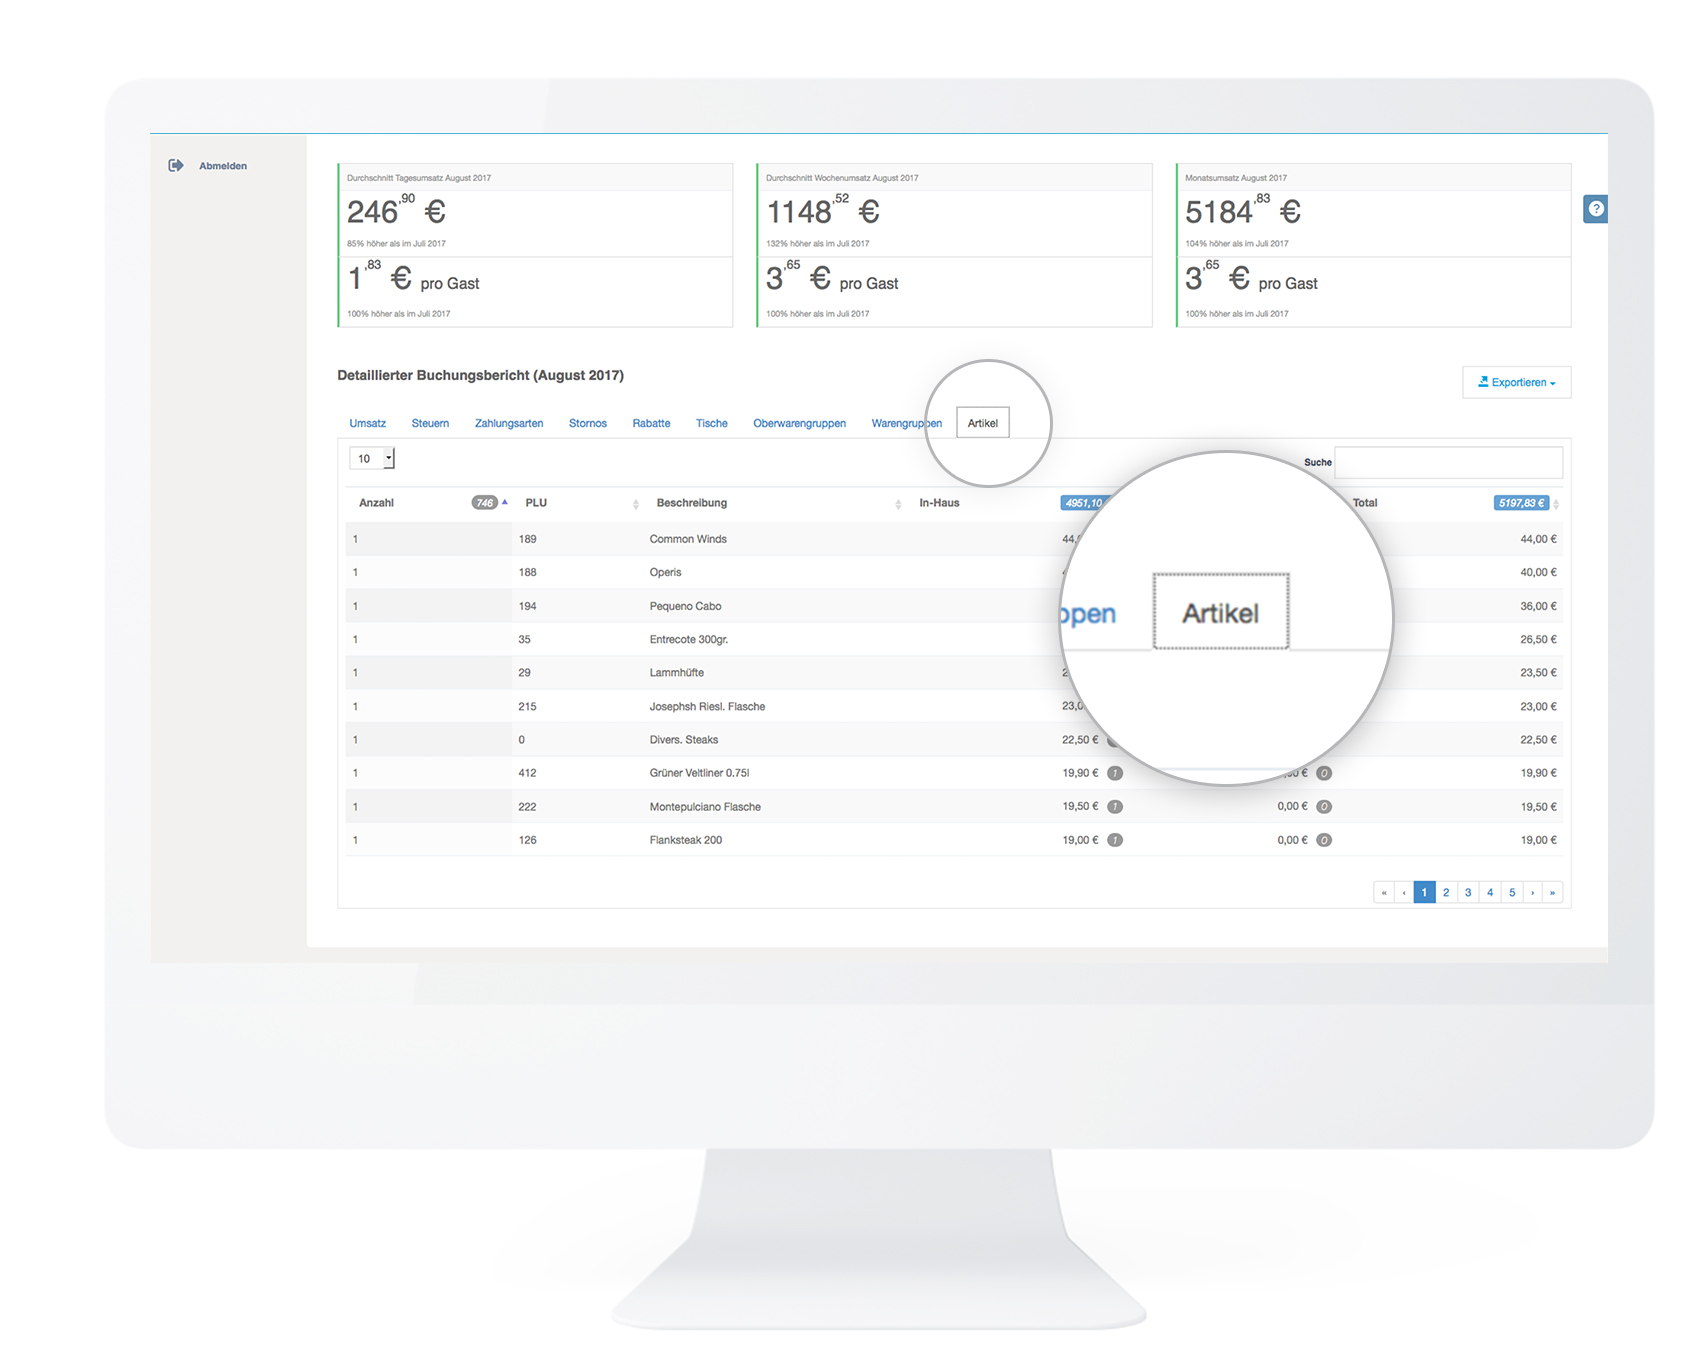
- With the tabs [Turnover], [Taxes], [Types of payment] etc. you can see, for example, which items are bought the most and which ones bring you the most revenue.
- Just click on the corresponding tab and then on the arrows in the columns and sort the sales in ascending or descending order.
- The evaluation period is taken from your settings above.
Play around with the analysis options on MY orderbird. You will surely quickly discover which analyses are the most exciting for you! :)
Downloading the report
Right below the detailed sales report, you have the option to [Export] it and save it on your computer for further analysis. You can choose between PDF and CSV file for the export.
How to import a CSV file into other programs without risking formatting errors, you will learn here: CSV export: advanced sales analysis.
I can't see my revenue!
You have been workin on a specific date, but you cannot select this day in your statistics? There may be several reasons for this.
1. Trigger Data Synchronization Again
One possible reason is that the data was not synchronized correctly. This can be resolved easily. Here’s how:
- Switch your statistics to the “Shift” view instead of Date.

- A drop-down menu will appear showing all available reports, including the missing one. Select the relevant report.

- This will re-synchronize the data, which will then also be visible in the date-based view.
2. End your shift
If the steps above do not resolve the issue, please check whether the shift was closed on the previous day. If a shift on your orderbird MINI is not closed, transactions on the following day will continue to be recorded in the same report. As a result, the revenue will appear in the statistics under the start date of the unclosed shift rather than under the actual transaction date.
Tip: Always close your shift before starting your next business day, or activate the automatic daily closing. This ensures that revenue is always assigned to the correct date.
Example: You start a shift on your MINI on January 14 and record several transactions. In the evening, you close your store but do not close the shift, and no automatic daily closing happens. The next day, January 15, you open the store and record additional transactions in the still-open shift from January 14. As a result, in the MY orderbird statistics the transactions from January 15 are displayed under January 14, because the report they belong to was started on January 14. Therefore, make sure to start a new shift every day before opening your store.